
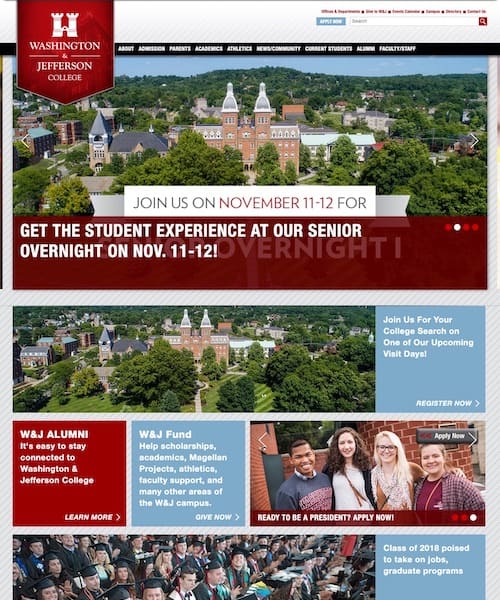
Remember this version of the website seen at the right? If you've been in our community for a while, you probably remember this and many other previous versions of the website. The newest and best version of washjeff.edu arrived last year around this same time. In the Fall of 2019, under the guidance of Kelly Kimberland, we embarked on an ambitious digital project. We pivoted technologies and rebuilt the entire website in WordPress in a matter of weeks. As a result of this effort, we created a website that is completely owned by the College, using open source technologies, and set up with the goals of allowing:
- broader community access to contribute content
- changes to happen more quickly
- flexibility and control in managing content
- greater insight into visitor behavior
It's through the last point that I want to share some insights with you. We now have a full year of data. Before we take a quick journey on some of the data highlights, let's first look at the timeline of major events over the past year. Swipe down or use the arrows to the left to start the show.
Major Events
October 7, 2019
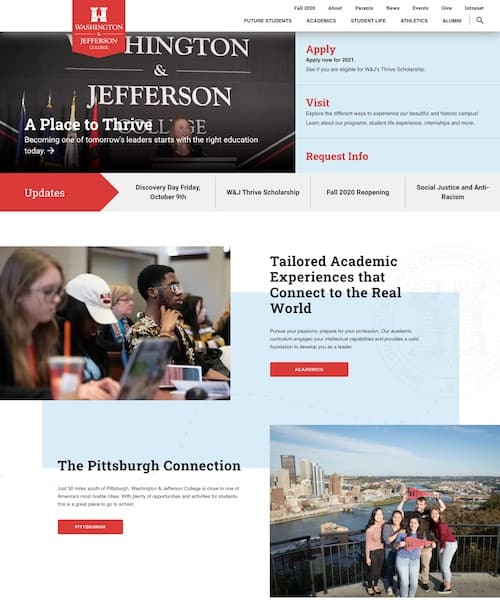
"V2" Launches
W&J launches the new Wordpress-based site on the Pantheon platform.
November 15, 2019
Enhanced Templates
Launched enhanced templates for academic programs, faculty, and offices. Created hooks for relationships between content entries.
November 26, 2020
Find a Counselor Feature
HTML5, geo-locating interactive map to find an admissions counselor launches.
January 15, 2020
News and Events
Launched enhanced news and events sub-system. New templates with improved user experience.
March 26, 2020
"V2.5" Launches
Changes to main header, updated design on main landing pages.
April 2020
Analytics Tracking
Added advanced tagging, monitoring, and reporting of website traffic and conversions, across multiple properties.
July 1, 2020
Refactored Theme
Reviewed 1000's of lines of code and CSS to create optimizations. Converted CSS to SCSS.
August 1, 2020
SEO Optimization
Project to optimize code and content. Created dozens of SEO-related improvements.
August 22, 2020
Migration to Kinsta Hosting
Brings greater performance and better search functionality.
Website Traffic
Our best data collection started in November of 2019, where we eliminated internal (on campus) traffic from metric reporting in order to get the best possible picture of external visitor traffic. The overall numbers in traffic remained steady throughout the year with a peak of just over 40,000 visitors during the month of March 2020.
Over 80% of our traffic are "new users," which indicates we have a healthy amount of prospective families looking at the website.

Google Analytics, Google Search Console. 9/1/19 - 8/31/20.
Search Engine Traffic
Much of the traffic that we saw highlighted above comes from search engines. In the case of Google we can see a positive uptick in visitors who arrive on our site by clicking a search result. Total impressions and clicks continue to increase from organic searches.


Bounce Rate
A good benchmark of positive visitor experience is bounce rate and the time they spend on the site. "Bounce rate" observes if the visitor arrives to your site on any given page and then leaves your site completely instead of visiting another page. We've seen an overall bounce rate of 45% which is quite good, with the previous month showing our lowest bounce rate to date - 37%. The average visitor spends over 2 minutes on the site and looks at 2 pages.
Again, these are overall traffic averages. A more detailed understanding will come from examining the homepage.
Homepage
Homepages are the most popular page of any given website, so therefore we can get deeper insight into user behavior. I'm pleased to share that only an average of 46% of new sessions start at the homepage. Why is this good? As we optimize our vast content throughout the site, visitors are searching through various search engines and landing on the content they are looking for deeper in the site. Most users arrive at a website with an agenda, so the closer that you can get to their destination, the better.
A low average bounce rate of just over 24% means that visitors are sticking around. The homepage is driving traffic into the website.

Where are people's eyeballs?
We have tools that help us understand what visitors are actually looking at and how they're behaving on a page. In this snapshot, we can see that visitors' maximum attention is right at the top of the homepage, right where we expect them. In August, we designed a change for this area so that we could a) optimize Admission's call-to-actions, and b) include headlines for information important to the entire College community.


Performance
We're constantly looking to get the highest performance we can from the website. Every millisecond of improvement means a better user experience. When we began to see website performance degrade in June 2020, we put into effect a plan to solve the root issue. In August, we migrated hosting providers and are now experiencing our best performance metrics since the initial launch a year ago.
Program Popularity
Because of the standardization between types of content, we can make "apples to apples" measurements in a few areas. For example, our academic programs follow a standard structure, so we can look at overall traffic patterns between programs. On the right is a chart of our 10 most-visited program pages. This data tells us two things:
- After pre-health professions, visitor traffic is evenly spread across our various programs
- There are overall low bounce and exit rates, meaning that our strategy of creating "related content" hooks is having a positive effect

Want to know what professor profiles are most popular? We're NOT telling!
Helpdesk
The helpdesk system for creating, tracking, and responding to requests related to the website launched in October 2019. The goal of this system was to make sure no requests, questions, or comments were ever lost. Since the helpdesk launched, we've responded to:
Closing
It's been a great year for washjeff.edu! We've been proud to serve our community of students, faculty, staff, and parents as we all work to improve how our website communicates with each one of you.
A special thanks to our partners; Tony for his masterful coding, Kevin for metrics and analysis, Farsay for SEO work, and Sedulen for their work on the "v2.5" project. Thanks to the entire Comms team - Erin, Tory, Sasha, John, Matt, and Sarah for contributing each of their special talents and skills to the project. Thanks to Kelly for leadership and direction. "Year one" has been a success and we all look forward to "year two" and beyond.
As I always say "we're here to make your life easier." And so, if there's anything we can do, just drop us an email at webhelp.
Best, Kris